Organize: Open a Project
Via the task pane or various context menus, a project can be opened by selecting Open or Open Project.
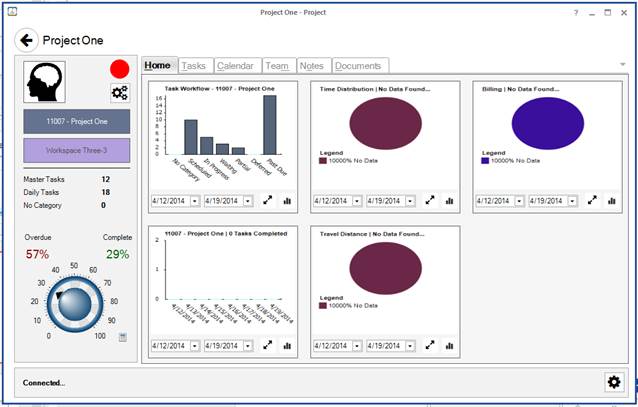
A project window is opened with the following tabs:
Project Form
The form is laid out with a back button at the top and the project’s title. The left side bar has a button to edit the project’s Properties, the symbol associated with the project, the Master Category List name, and the Workspace name.
The right pane is a tab control for viewing and managing the different objects that have been assigned to the project including, tasks, appointments, contacts, OneNote notes (if enabled), and documents (if a document folder is associated with the project).
The bottom bar is reserved for dynamic buttons that appear and change according to the type of object that is selected. The bottom bar also has the Settings button for the Project form where the project form display can be customized.
Left Pane
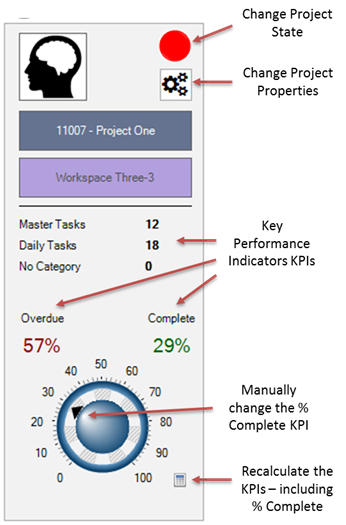
Project State
The project state is a quick indicator on the “health” of the project. In FocusMe we use Red, Amber, and Green. A best practice for declaring the state is to use the following definitions:
Green: On-Track – All tasks are on track, none are overdue and project risk is manageable; confidence is high the project will be complete as per the schedule.
Amber: Off-Track but Recoverable – some tasks are overdue and the project is in jeopardy of missing the project deadline, however, the schedule is recoverable. That is we can still meet the project due date with some extra effort from the project team.
Red: Off-Track – many tasks are overdue, project risk is high and it is likely that the project will miss its desired deadline. Effort from outside of the project team is required for the project to recover.
When the project state button is selected it will cycle thru Green, Amber, and Red.
Edit Project Properties
All fields associated with a project can be updated via the Project Properties dialog.
Key Performance Indicators
There are over thirty (30) statistics that are regularly gathered – see the Statistics tab in the Project Properties dialog. The user can select up to three KPIs to show on the Project Open window. Use the Settings button in the lower right corner of the Project window to change the KPIs and selected operating settings.
NOTE: KPI selection is not yet
supported in this version…
Recalculate Button (Calculator Icon)
When the calculator button is selected, the KPIs will be recalculated so that the % complete will be based on the # of completed tasks as a percentage of all scheduled tasks. The percent complete number can be manually adjusted by the Project owner to better indicate the amount for work that has been completed independent of the tasks that have been recorded and are being analyzed. Simple select the knob control and change the location of the arrow.
All KPIs listed in the left pane will be updated when the Calculator button has been selected.
Bottom Bar

The bottom bar buttons change according to the tab and the view that is selected.
There are three main sections; 1) FocusSync status – connected or disconnected from FocusSync (Ceptara’s cloud service), 2) Action Buttons – depending on the tab and the view these buttons will change, and 3) Settings – the user preferences for the Project window.
Action Buttons
|
|
Add an item |
|
|
Delete an item |
|
|
Edit an item |
|
|
Move back in the hierarchy |
|
|
Move forward in the hierarchy |
|
|
Select list view |
|
|
Select Gantt view |
|
|
Select Calendar view |
|
|
Open folder in Windows explorer |
|
|
Open a document |
Settings
Opens a dialog where settings can be changed to modify the default behaviors.
Home Tab
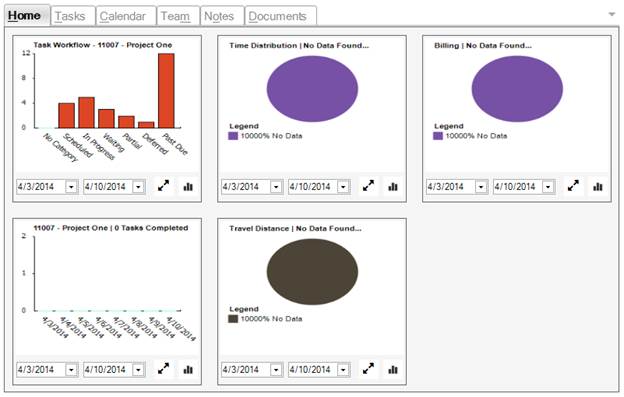
The Home tab contains several charts – each chart can be manipulated independently. The default date range is for “last week”, i.e. From Today minus seven days to Today. The charts that appear on the home page cannot currently be changed by the user, however, subsequent releases will support the user customizing which charts to show by default.
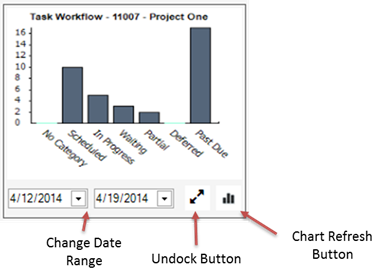
For each chart, the date range can be changed. Then by pressing the Refresh button the chart will redraw itself with the new date selection. The chart can also be undocked from the Open Project window:
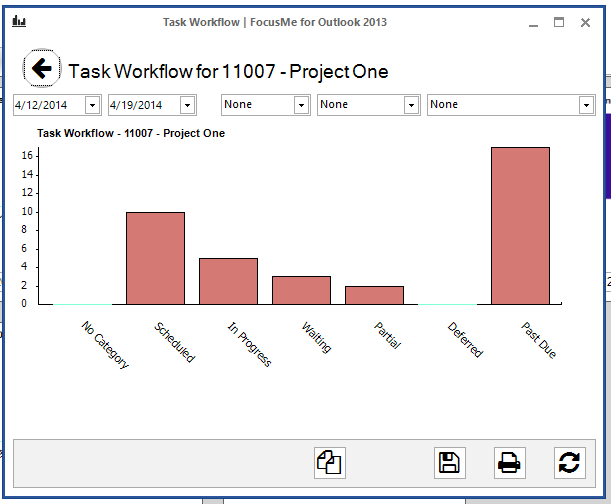
This allows the user to manipulate the current chart, copy the chart to the clipboard, save an image of the chart to the disk, or print the chart. Additionally, different KPIs can be selected and charted using the drop downs on the right of the chart.
Tasks Tab
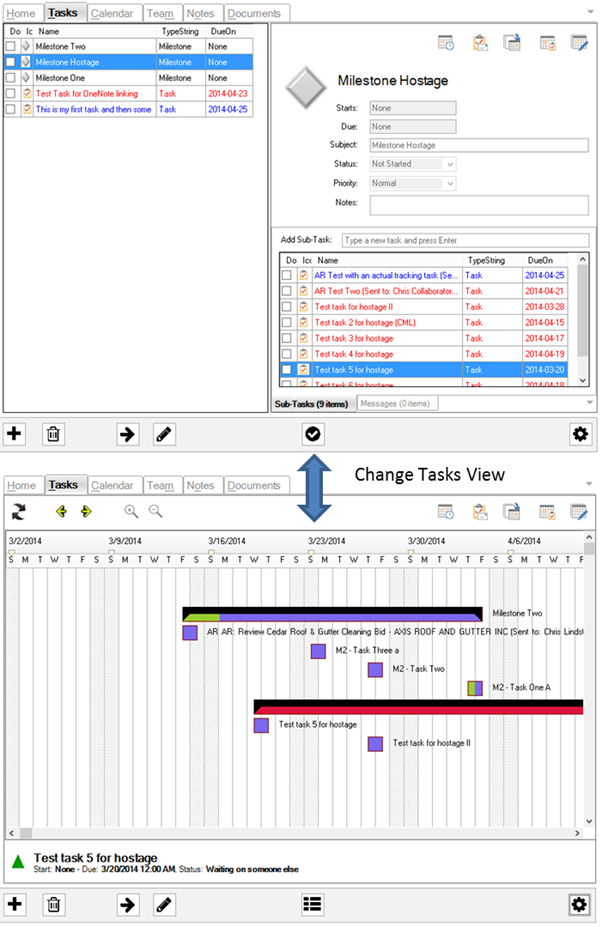
The Tasks tab supports two views; 1) list view and 2) Gantt chart view. The view can be change by selecting the view button in the center of the bottom pane.
Tasks can be added, edited or deleted using the bottom pane buttons and the right-click context menu (on list view). The Gantt view does not currently support a context menu and is discussed in more detail below.
Tasks List View
The tasks list view supports a task hierarchy – parent / child relationships. Tasks can be dragged and dropped from one list to another to assign their parent task or remove an assignment. Any task can be ‘right-clicked’ to present the Task context menu.
Tasks Gantt View
The tasks on the Gantt view support these mouse actions:
· Drag the task horizontally with the left mouse key – modifies the due date and start date (if it exists).
· Drag the task horizontally with the right mouse key – changes the task duration starting at the start date and ending at a due date specified by when the mouse key is released.
· Drag the task with the left mouse key onto a ‘milestone’ or parent task changes the task’s parent assignment.
Calendar Tab
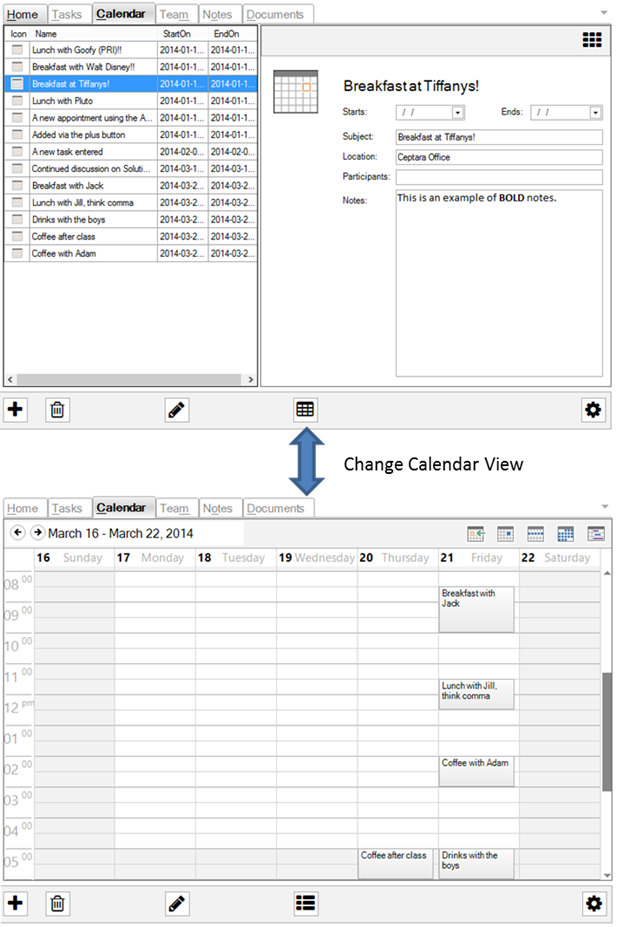
The Calendar supports two views; a) list view and b) appointment view. The view can be change by selecting the view button in the center of the bottom pane.
Appointments can be added, edited or deleted using the bottom pane buttons and the right-click context menu.
Contacts or Team Tab
Notes Tab
Documents Tab
Copyright (c) Ceptara Corp.